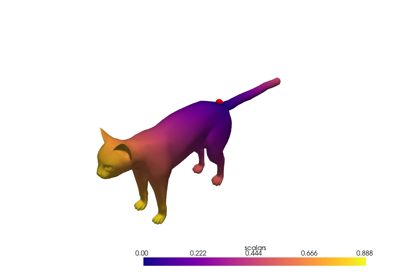
pyFM.viz.plot_arrows
- pyFM.viz.plot_arrows(points, vfield, *, color='black', cmap='viridis', clim=None, rescale=1.0, scale_by_norm=True, tolerance=None, show_colorbar=False, opacity=1.0, pl=None, return_plot=False)
Plot a vector field as arrows.
Each arrow starts at a point of
pointsand is oriented along the matching row ofvfield.- Parameters:
points (np.ndarray - (p,3) or (3,) base point of each arrow)
vfield (np.ndarray - (p,3) or (3,) vector carried by each arrow)
color (str - a fixed color name for every arrow, or the special value) –
"magnitude"to color each arrow by its norm throughcmapcmap (str - matplotlib colormap name, used when
coloris"magnitude")clim ((2,) - color limits, used when
coloris"magnitude")rescale (float - global scale factor for arrow length)
scale_by_norm (bool - if True arrow length is proportional to the vector norm, otherwise) – every arrow has the same length
tolerance (float - merge points closer than this fraction of the bounding box, to draw) – fewer arrows
show_colorbar (bool - display the color bar)
opacity (float - opacity of the arrows)
pl (pyvista.Plotter - returned when
plwas given orreturn_plotis True.)return_plot (bool - return the plotter instead of showing it)
Output
------------------------------
pl – Otherwise the plot is shown and None is returned.