pyFM.viz.plot_mesh
- pyFM.viz.plot_mesh(mesh, scalars=None, *, cmap='viridis', clim=None, points=None, points_scalars=None, points_cmap='viridis', points_clim=None, points_color='red', point_size=12.0, vfield=None, vfield_color='black', vfield_cmap='viridis', vfield_rescale=1.0, vfield_scale_by_norm=True, vfield_tolerance=None, wireframe=False, line_width=None, smooth=True, opacity=1.0, color='white', show_colorbar=False, interpolate_before_map=True, pl=None, camera_position=None, return_plot=False)
Plot a mesh or point cloud, optionally with extra points and a vector field.
scalarsholds the scalar or RGB data,cmapholds the name of the matplotlib colormap used to turn scalar data into colors. Values may be given per vertex or per face; the domain is deduced from the array length.- Parameters:
mesh (object exposing
.vertices(n,3) and optionally.faces(m,3) (a point cloud has no faces or faces=None))scalars (np.ndarray - (n|m,) scalar values or (n|m,3) RGB values in [0,1])
cmap (str - matplotlib colormap name, used when
scalarsis 1-dimensional)clim ((2,) - color limits for
scalars)points (np.ndarray - extra points drawn on top of the mesh. integer array is) – read as vertex indices of
mesh.vertices; a float(3,)or(p,3)array is read as coordinates.points_scalars (np.ndarray - (p,) scalar or (p,3) RGB values coloring
points.) – When None, the points are drawn inpoints_color.points_cmap (str - matplotlib colormap name for scalar
points_scalars)points_clim ((2,) - color limits for
points_scalars)points_color (str - color used when
points_scalarsis None)point_size (float - radius of the rendered points)
vfield (np.ndarray - (n,3) or (m,3) vector field. A per-face field is drawn at the) – face barycenters.
vfield_color (str - a color name for every arrow (default
"black"), or the special) – value"magnitude"to color each arrow by its norm usingvfield_cmapas matplotlib colormap name.vfield_cmap (str - matplotlib colormap name, used when
vfield_coloris) –"magnitude"vfield_rescale (float - global scale factor for arrow length)
vfield_scale_by_norm (bool - if True arrow length is proportional to the vector norm,) – otherwise every arrow has the same length
vfield_tolerance (float - merge arrows closer than this fraction of the bounding box, to) – draw fewer of them
wireframe (bool - draw the mesh edges)
line_width (float - width of the wireframe edges)
smooth (bool - use smooth shading)
opacity (float - opacity of the mesh)
color (str - solid color used when
scalarsis None)show_colorbar (bool - display the color bar)
interpolate_before_map (bool - interpolate scalars before mapping them to colors)
pl (pyvista.Plotter - returned when
plwas given orreturn_plotis True.)camera_position (str or (3,3) - camera position for the plot. If None, the default is used)
return_plot (bool - return the plotter instead of showing it)
Output
------------------------------
pl – Otherwise the plot is shown and None is returned.
Examples using plot_mesh
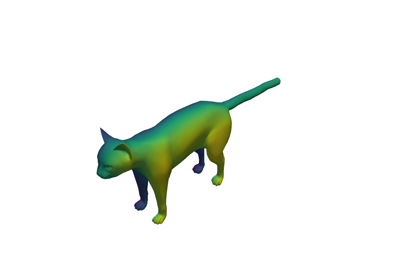
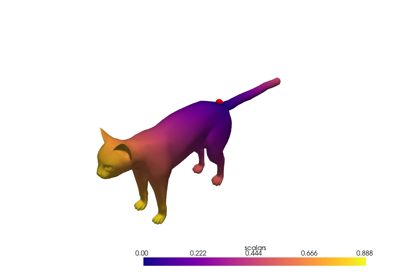
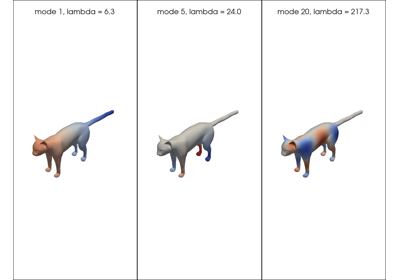
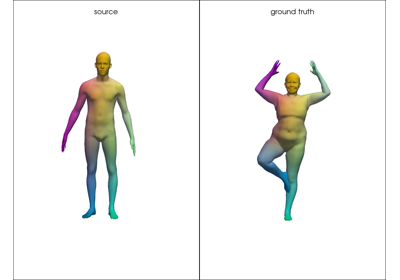
Encoding Dense Correspondences in a Functional Map